











Support and Resistance Levels: How to Read Charts on Indian Stocks
Support and resistance levels mark price zones where buying or selling interest historically clustered on Indian stock charts.

Markets, GDP, energy, trade, and company restructuring explainers.
Support and resistance levels mark price zones where buying or selling interest historically clustered on Indian stock charts.

Position sizing risk management defines how much capital you expose per trade—a core discipline for NSE and BSE participants beyond entry signals.
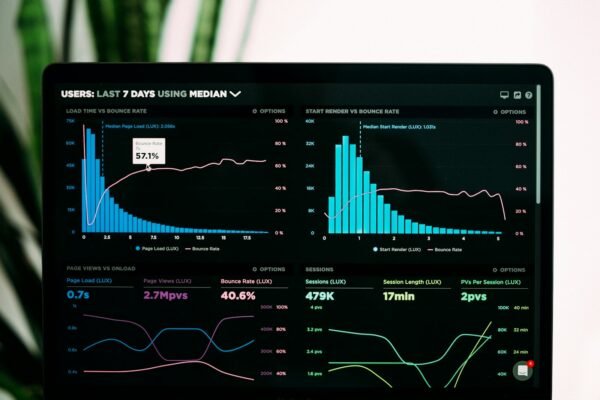
A stop-loss order explained for Indian markets covers trigger prices, order types, and execution risks on NSE and BSE cash segments.

Nifty weekly expiry options offer short-dated contracts on NSE with distinct gamma, theta, and liquidity patterns from monthly series.

On July 15, 2026 the Union Cabinet approved a ₹62,500 crore Mobile Phone Manufacturing Scheme to succeed PLI, with tiered incentives tied to domestic sourcing, design, and Indian brand ownership. Here is how it works and what remains unclear.

Futures vs options India contracts differ in obligation, margin, and payoff shape—core concepts for anyone learning NSE and BSE derivatives.

India VIX measures expected Nifty volatility from option prices and is widely watched as a sentiment and risk gauge on Indian markets.

Bank Nifty tracks twelve major banks while Nifty 50 spans fifty large caps—creating different volatility, sector exposure, and trading dynamics on NSE.

JioHotstar hit a record 530 million monthly users in the June 2026 quarter as IPL 2026 and a hybrid subscription model reshaped India’s streaming economics.

The RBI has rewritten dividend rules for commercial banks, tying payouts to capital strength through a new CET1-based grid. Here is what it means for PSU bank dividends, government revenue, and shareholders.