










India IIP June 2026 is the core development covered in this report. Below is a sourced breakdown of what is confirmed, what remains uncertain, and why it matters.
Why India IIP June 2026 matters now
This section focuses on the practical implications of India IIP June 2026 for readers following the story — what changed, what is confirmed, and what remains open.
India’s factory and utility output accelerated in June 2026, according to Quick Estimates of the Index of Industrial Production (IIP) released by the Ministry of Statistics and Programme Implementation (MoSPI) on 28 July 2026. Overall IIP growth rose to 7.3% year-on-year, from a revised 5.1% in May, with the June index level at 123.1 versus 114.7 a year earlier.
The print is useful because it arrives after MoSPI switched the IIP series (base 2022–23) from a Wholesale Price Index deflator to the Output Producer Price Index (Output PPI). That methodological change affects how “real” output is measured for value-based items, so the June release is both a growth signal and a measurement reset that markets and policymakers will need to interpret carefully.
What MoSPI reported for June 2026
Sectorally, manufacturing expanded 7.8%, electricity and gas supply grew 10.6%, water supply, sewerage and waste management rose 6.1%, and mining and quarrying increased only 1%. Within manufacturing, 19 of 23 industry groups recorded positive growth. The largest manufacturing contributors were electrical equipment (34%), motor vehicles, trailers and semi-trailers (17.5%), and food products (10.8%).
On the use-based classification, capital goods led at 14.2%, followed by intermediate goods (9.3%), consumer durables (7.7%), infrastructure and construction goods (7.5%), and primary goods and consumer non-durables (each 4.9%). MoSPI said intermediate, primary and capital goods were the largest contributors to overall industrial production growth in June.
A useful comparison from the primary numbers
Two simple checks help separate “headline strength” from composition. First, the index arithmetic: 123.1 divided by 114.7 equals about 1.0732, confirming MoSPI’s 7.3% year-on-year figure. Second, the acceleration from May’s revised 5.1% is 2.2 percentage points—material, but concentrated. Manufacturing grew nearly eight times as fast as mining (7.8% versus 1.0%). Capital goods grew almost three times as fast as consumer non-durables (14.2% versus 4.9%).
That pattern is consistent with investment- and intermediate-goods strength rather than a broad household-consumption boom. Electrical equipment’s 34% jump—helped by switching apparatus, UPS and solid-state drives, and optical-fibre connectors—also points to power-equipment and electronics-linked activity, not a uniform industrial cycle.
| Series (June 2026) | YoY growth | Reading relative to overall 7.3% |
|---|---|---|
| Overall IIP | 7.3% | Baseline |
| Manufacturing | 7.8% | Slightly above baseline |
| Electricity & gas | 10.6% | Well above baseline |
| Mining & quarrying | 1.0% | Far below baseline |
| Capital goods | 14.2% | Strongest use-based category |
| Consumer non-durables | 4.9% | Softest major use-based print |
Why the PPI deflator change matters
MoSPI has adopted Output PPI as the deflator for the new IIP series and says the revised PPI-based series supersedes the earlier WPI-based IIP 2022–23 series released on 1 June 2026. The switch affects 234 of 463 item groups, about 36.02% of overall index weight. The ministry argues Output PPI offers a more detailed producer-price structure for items reported in value terms and aligns with international practice recommended by the Technical Advisory Committee on the IIP base revision.
For users, the practical implication is continuity risk. Year-on-year growth in June is still comparable within the new series, but longer historical comparisons that mix WPI-deflated and PPI-deflated vintages can misstate the cycle. Analysts should prefer the PPI-based series MoSPI now designates as authoritative, and treat early months of the new series as higher-uncertainty observations until a longer run of revisions settles.
Scenarios and risks to watch
Base-case continuity: If capital-goods and electrical-equipment momentum persists into July–August, the IIP would support a narrative of investment-linked industrial activity even if mining stays soft. That would matter for machinery, autos and power-equipment supply chains.
Concentration risk: A large share of manufacturing strength is currently narrow. If electrical equipment and motor vehicles cool, headline IIP could slow even without a broad recession signal. Soft consumer non-durables already hint that mass-market demand is not leading.
Measurement risk: Because the deflator change is recent, revisions and communication lags could produce volatility in market interpretation. A strong print that later revises lower—or a weak print that revises higher—would be especially confusing while markets are still learning the PPI-based series.
Energy-cost pass-through: Electricity and gas grew 10.6%, which can reflect either stronger demand or base effects. Separately, elevated or volatile fuel and logistics costs can still compress manufacturing margins even when physical output rises—output growth is not the same as profitability.
What the data cannot establish
The June IIP cannot establish full-year FY27 industrial growth, GDP growth, employment, or corporate earnings. It is a monthly volume index with Quick Estimate status, not a complete national-accounts release. It also cannot prove that capital formation has permanently shifted upward; capital-goods strength in one month is a coincident-to-lagging investment clue, not a completed investment cycle. Finally, IIP does not measure services, agriculture, or informal-sector conditions, so it is an incomplete map of the real economy.
Reader FAQ
Is 7.3% unusually strong? It is a clear acceleration from May’s revised 5.1% and is led by manufacturing and utilities. Whether it is “strong” in a multi-year sense depends on the new base and PPI deflator; users should compare within the PPI-based series rather than mix vintages casually.
Does capital-goods growth mean investment is booming? It is consistent with investment-related activity, but one month cannot establish a boom. Look for persistence across several months and corroboration from credit, project announcements and capital-goods imports.
Why did mining lag so far behind? MoSPI reported only 1% mining growth. The release does not, by itself, diagnose weather, ore grades, regulatory pauses or base effects; it simply shows mining did not drive the June acceleration.
Should this change monetary-policy expectations? IIP is one input among many. Inflation, food prices, currency conditions and global energy shocks typically dominate near-term policy debates more than a single industrial print.
Primary sources
This explainer draws on MoSPI’s June 2026 IIP Quick Estimates coverage and methodology notes, plus MoSPI’s public IIP data portal. For verification, start here:
- Ministry of Statistics and Programme Implementation (MoSPI)
- MoSPI eSankhyiki IIP macroindicators
- Economic Times report of MoSPI June 2026 IIP release (28 July 2026)
Disclaimer: This article is for informational and educational purposes only. It is not investment, trading or financial advice.
Related Topic Express coverage
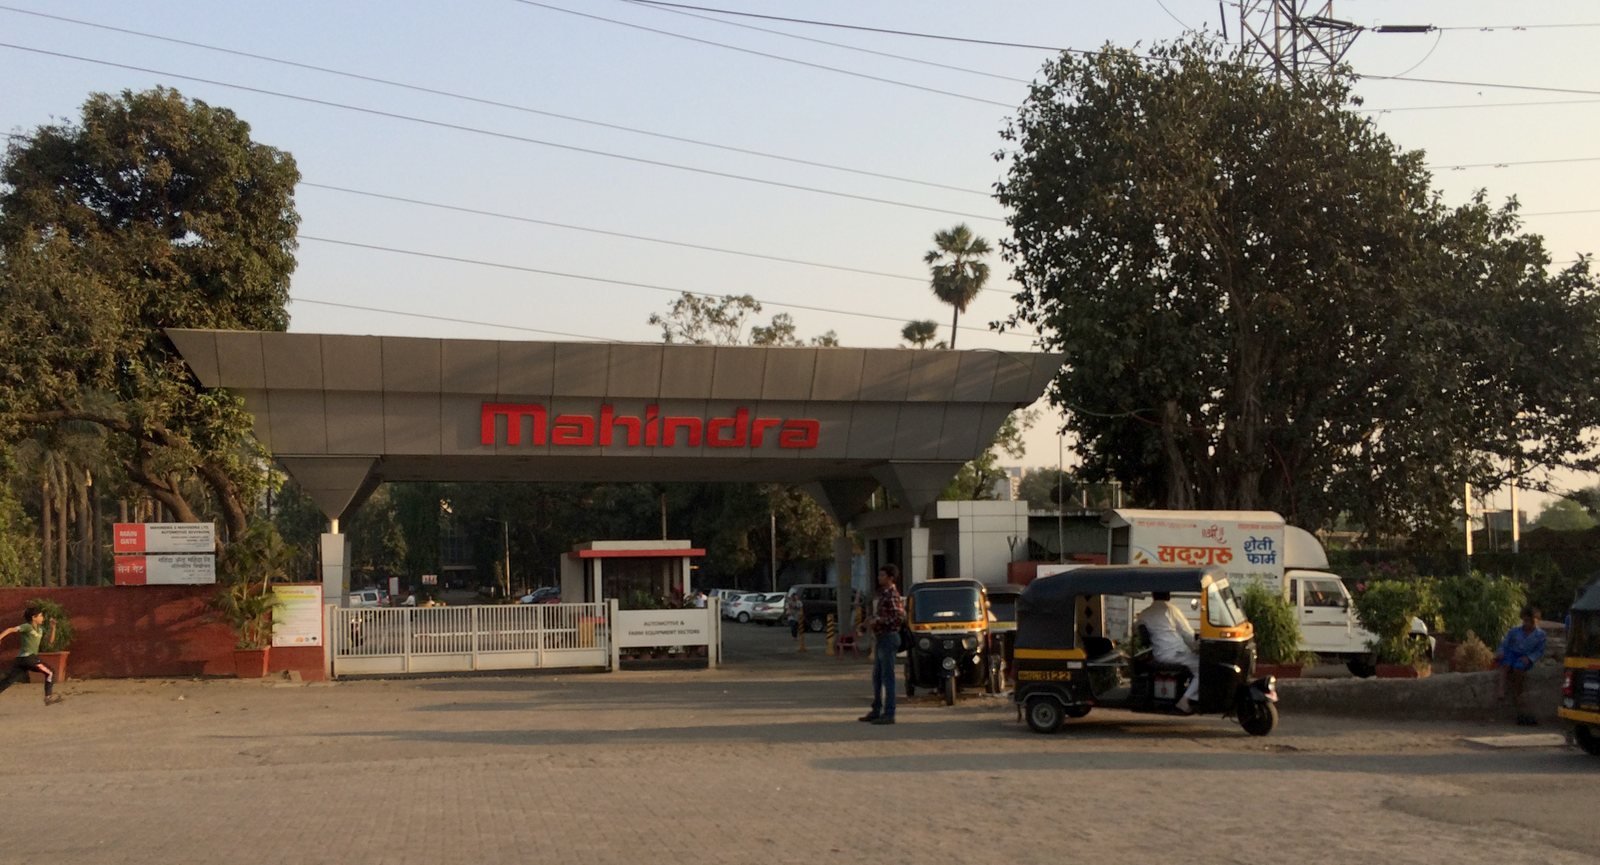
Featured image: Ask27 / Wikimedia Commons (CC BY-SA 4.0)